We suggest utilizing the VS Code Extension for debugging to enhance the developer experience.
By employing the VS Code extension, you can debug your tests directly within VS Code, view error messages, establish breakpoints, and step through your tests.
Share at:
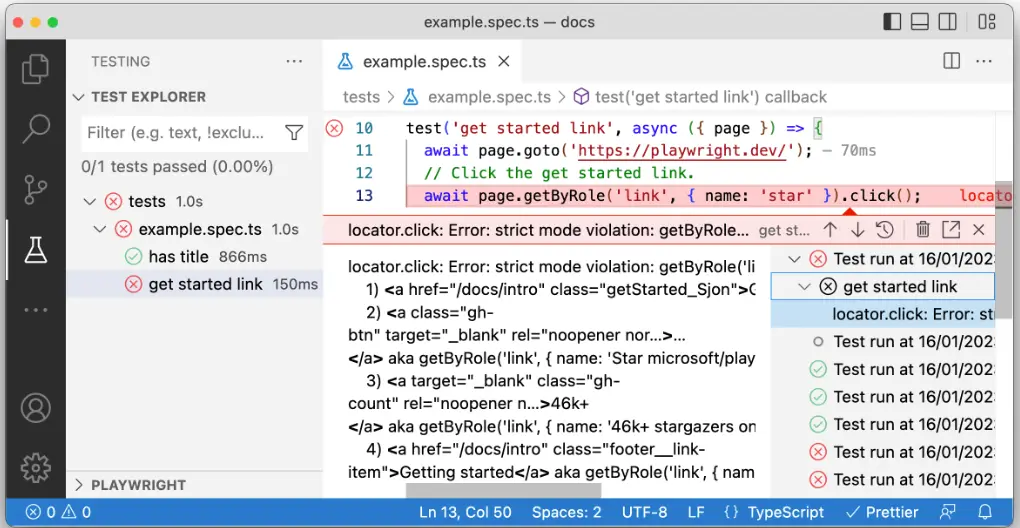
Error Messages
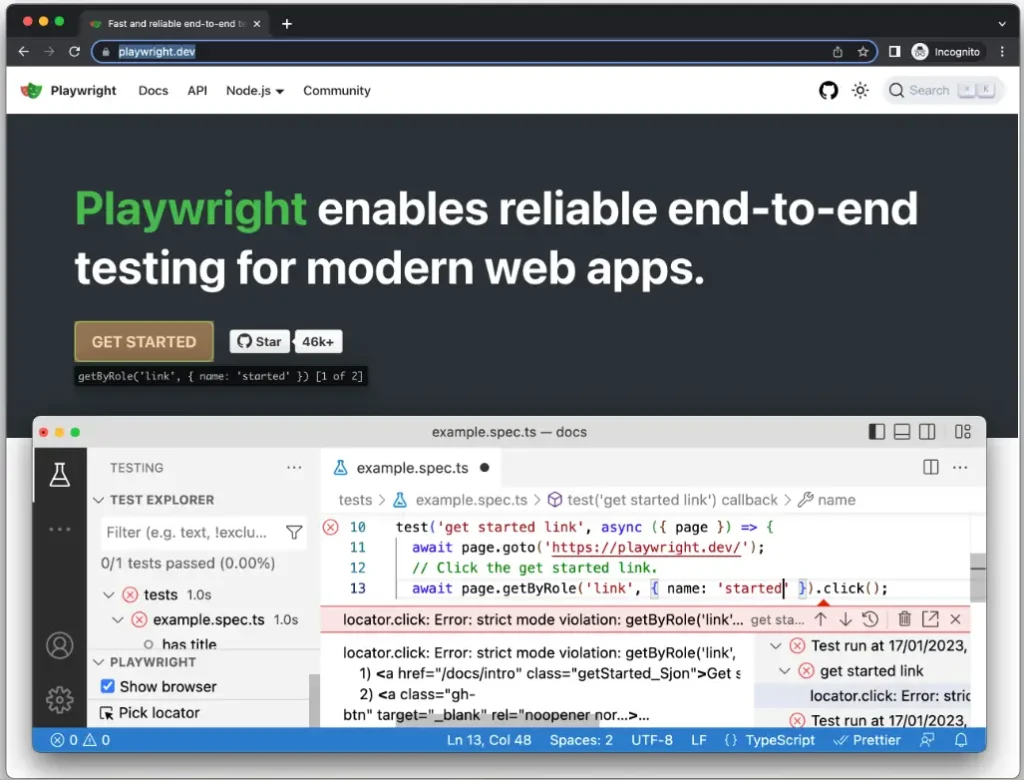
If your test does not pass, VS Code will display error messages directly within the editor, indicating what was anticipated, what was actually received, and providing a comprehensive call log.
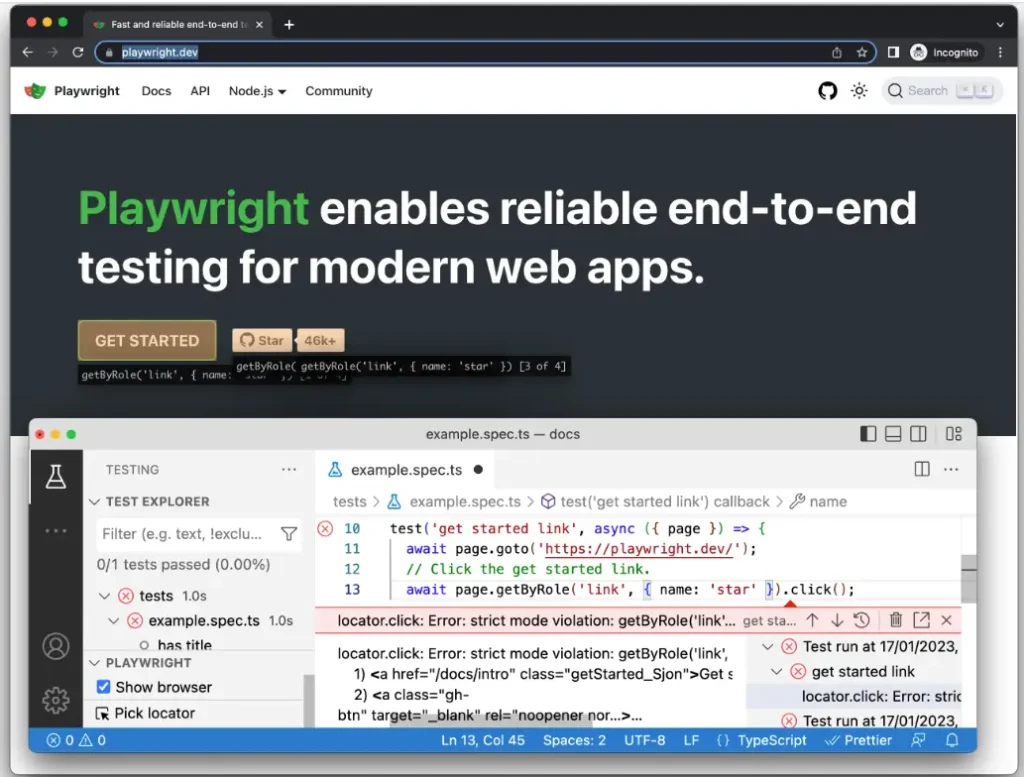
Live Debugging
You have the ability to debug your test in real-time within VS Code. Once you execute a test with the Show Browser option enabled, simply click on any of the locators in VS Code, and it will be highlighted in the Browser window. Additionally, Playwright will indicate if there are multiple matches.
You have the option to modify the locators within VS Code, and Playwright will display the updates in real-time in the browser window.
Picking a Locator
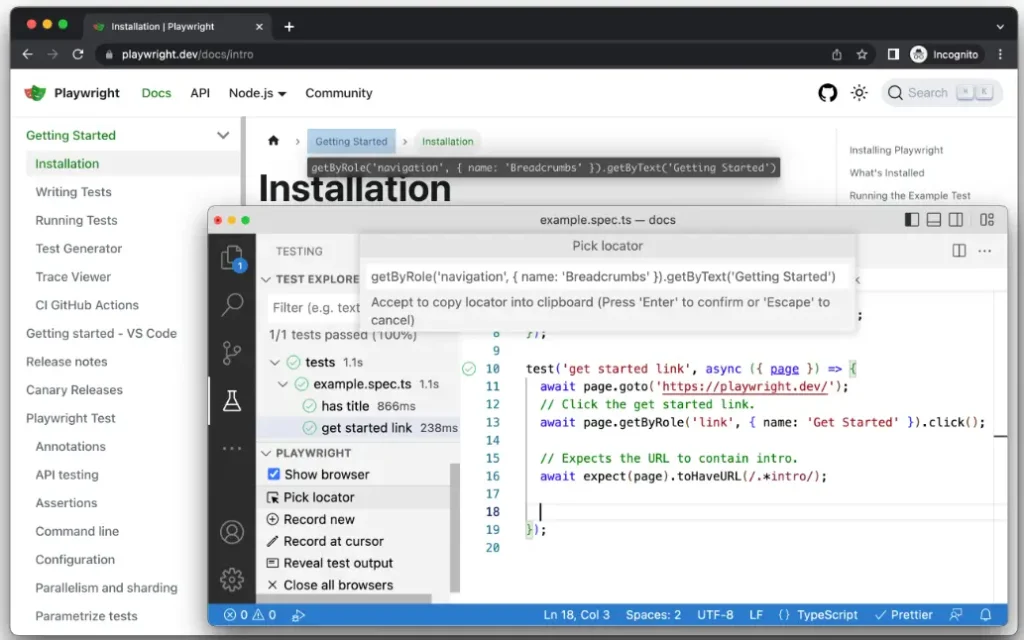
Select a locator and transfer it to your test file by clicking the ‘Pick locator’ button located in the testing sidebar. Next, in the browser, click on the desired element, which will then appear in the ‘Pick locator’ box within VS Code. To copy the locator to your clipboard, press ‘enter’ on your keyboard, and you can then paste it anywhere in your code. Alternatively, if you wish to cancel, press ‘escape’.
Playwright will analyze your page to determine the most effective locator, giving precedence to role, text, and test ID locators. In cases where Playwright detects several elements that correspond to the locator, it will enhance the locator to ensure it is robust and can uniquely identify the intended element, alleviating concerns about test failures caused by locators.Playwright will analyze your page to determine the most effective locator, giving precedence to role, text, and test ID locators. In cases where Playwright detects several elements that correspond to the locator, it will enhance the locator to ensure it is robust and can uniquely identify the intended element, alleviating concerns about test failures caused by locators.
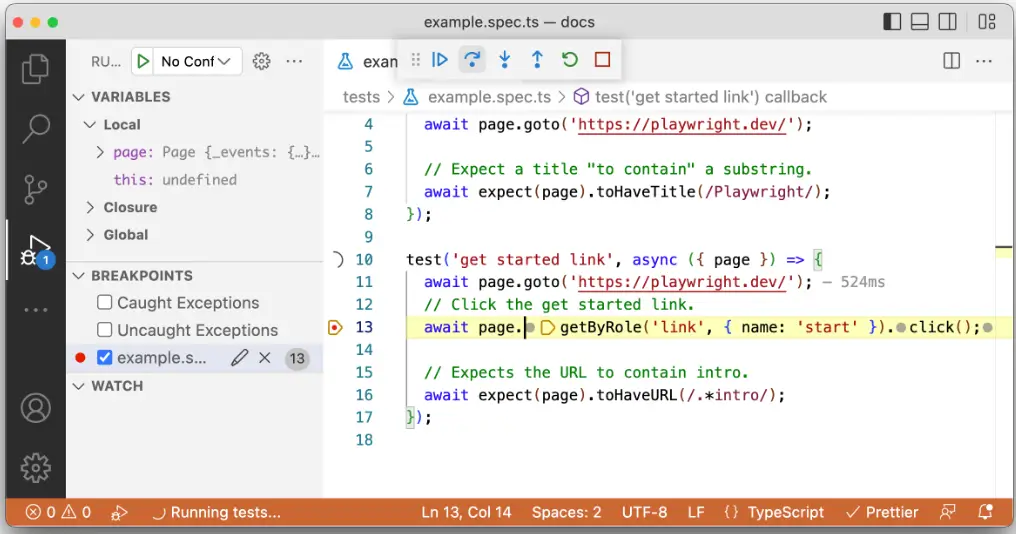
Run in Debug Mode
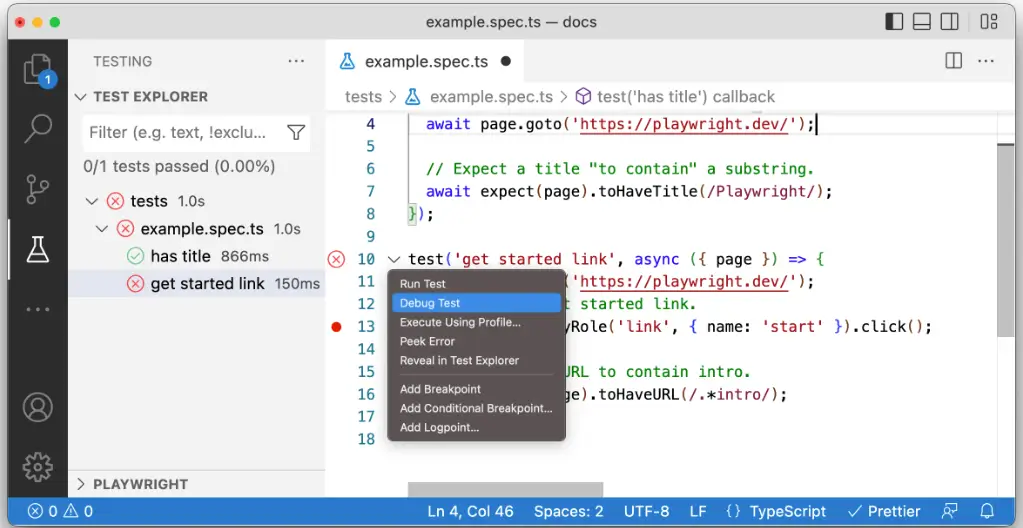
To establish a breakpoint, click adjacent to the line number where you wish to place the breakpoint until a red dot is visible. Execute the tests in debug mode by right-clicking on the line next to the test you intend to run.
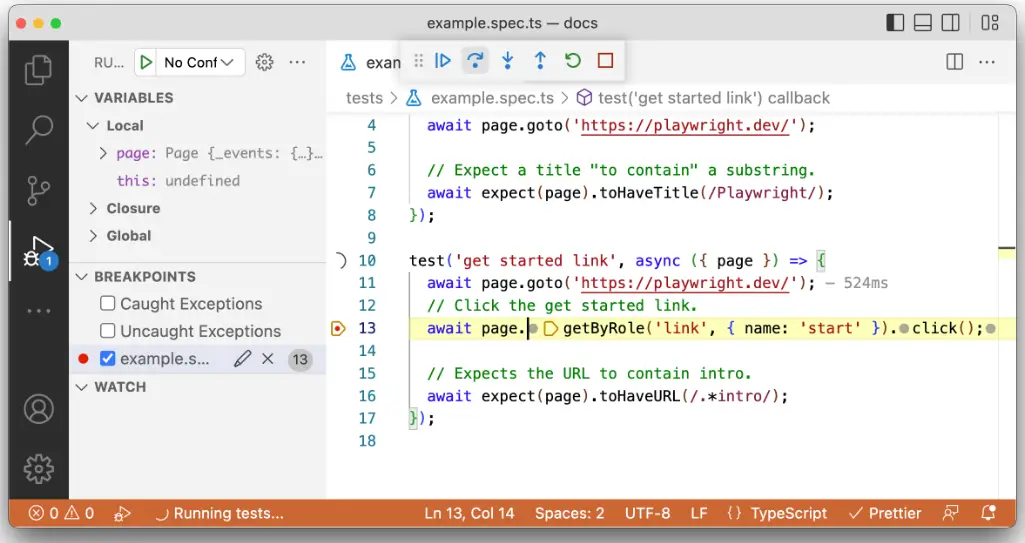
A browser window will be launched, and the test will execute, pausing at the designated breakpoint. You have the option to step through the tests, pause the execution, and rerun the tests via the menu in VS Code.
Debug Tests Using Chrome DevTools
Rather than utilizing Debug Test, opt for Run Test in VS Code. By enabling Show Browser, the browser session is retained, allowing you to access Chrome DevTools for ongoing debugging of your tests and the web application.
Debug in different Browsers
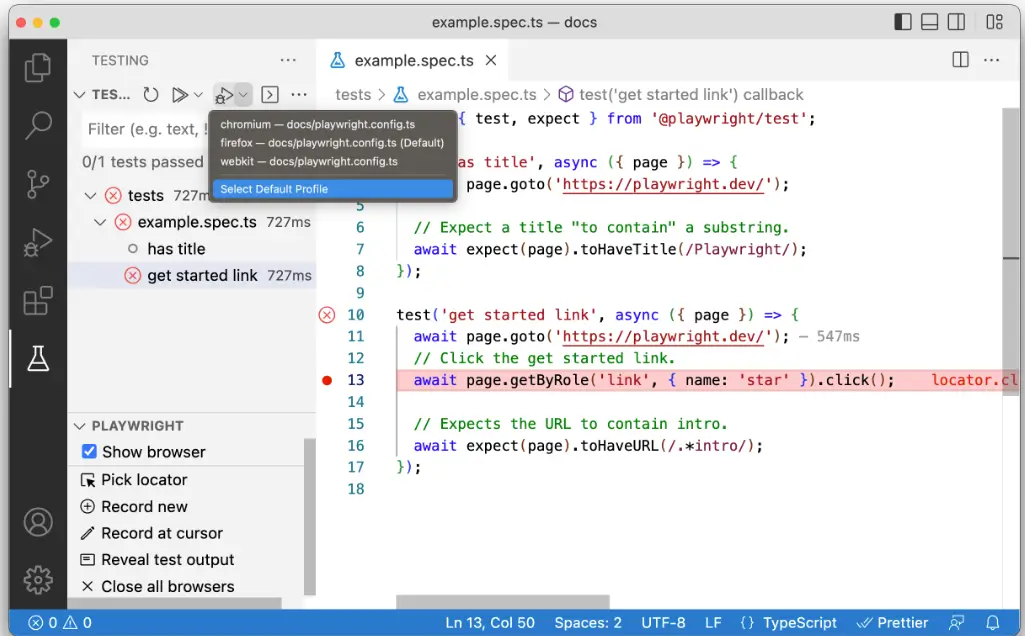
By default, debugging utilizes the Chromium profile. You can perform debugging on various browsers by right-clicking the debug icon in the testing sidebar and selecting the ‘Select Default Profile’ option from the dropdown menu.
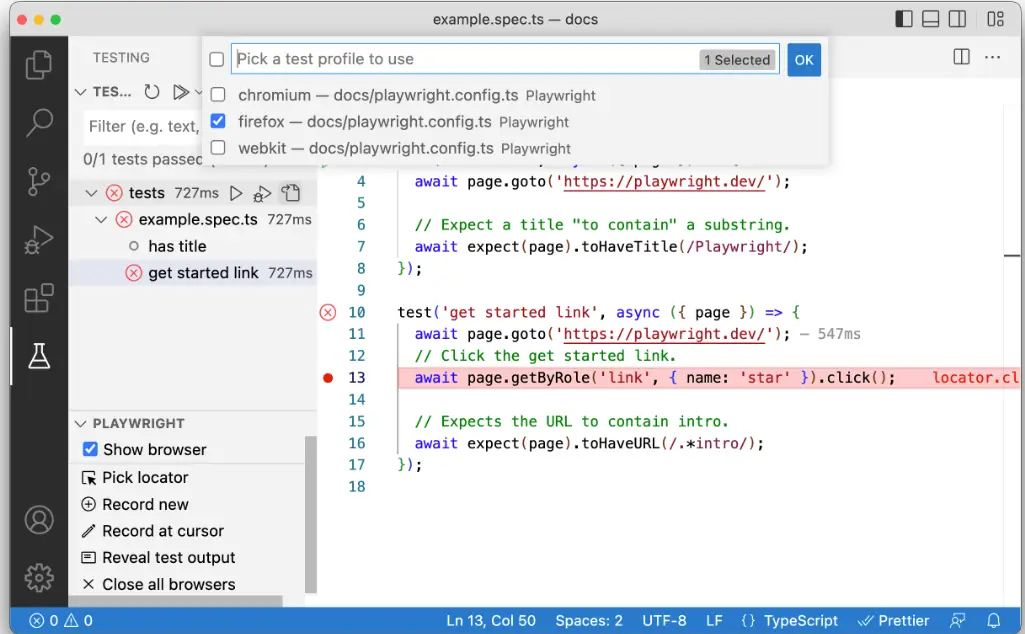
Subsequently, select the test profile you wish to utilize for debugging your tests. Each time you execute your test in debug mode, it will employ the profile you have chosen. You can initiate tests in debug mode by right-clicking the line number corresponding to your test and selecting ‘Debug Test’ from the menu.
Playwright Inspector
The Playwright Inspector serves as a graphical user interface tool designed to assist in debugging Playwright tests. It enables users to navigate through their tests step by step, modify locators in real-time, select locators, and view actionability logs.
Run in debug mode
Execute your tests using the –debug flag to access the inspector. This setting prepares Playwright for debugging and activates the inspector. When the –debug option is employed, several beneficial defaults are established:
Browsers are initiated in headed mode.
The default timeout is configured to 0 (= no timeout).
Debug all tests on all browsers
To troubleshoot all tests, execute the test command with the –debug flag. This will run the tests sequentially, opening the inspector and a browser window for each individual test.
npx playwright test --debug
Debug one test on all browsers
To troubleshoot a specific test on a designated line, execute the test command along with the name of the test file and the line number of the test you wish to debug, followed by the –debug flag. This action will initiate a single test in every browser set up in your playwright.config and will launch the inspector.
npx playwright test example.spec.ts:10 --debug
Debug on a specific browser
In Playwright, it is possible to set up projects within your playwright.config file. After the configuration is complete, you can debug your tests on a designated browser or mobile viewport by utilizing the –project flag, followed by the name of the project specified in your playwright.config.
					npx playwright test --project=chromium --debug
npx playwright test --project="Mobile Safari" --debug
npx playwright test --project="Microsoft Edge" --debug
Debug one test on a specific browser
To execute a single test on a designated browser, include the name of the test file along with the line number of the test you wish to debug, in addition to the –project flag succeeded by the project’s name.
npx playwright test example.spec.ts:10 --project=webkit --debug
Stepping through your tests
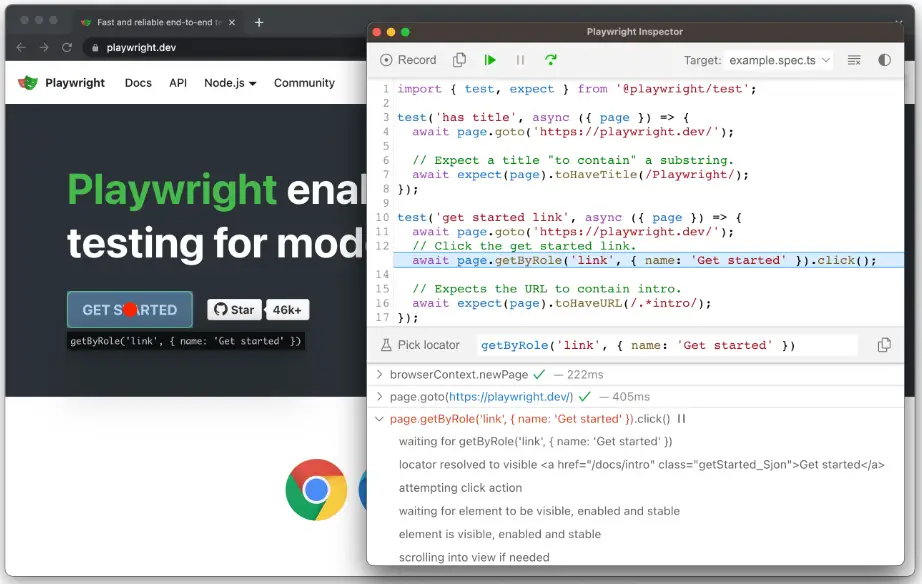
You have the ability to play, pause, or navigate through each action of your test by utilizing the toolbar located at the top of the Inspector.
The current action is highlighted in the test code, while corresponding elements are emphasized in the browser window.
Run a test from a specific breakpoint
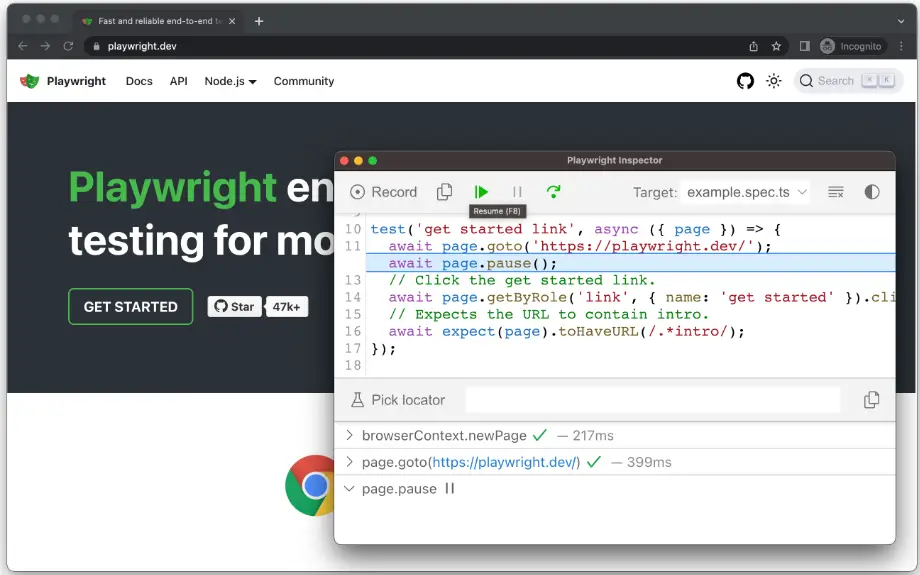
To expedite the debugging process, you may incorporate a page.pause() method into your test. This approach will eliminate the need to step through every action of your test in order to reach the specific point where you wish to debug.
await page.pause();
After incorporating a page.pause() call, execute your tests in debug mode. By clicking the “Resume” button in the Inspector, the test will proceed and will only halt at the page.pause().
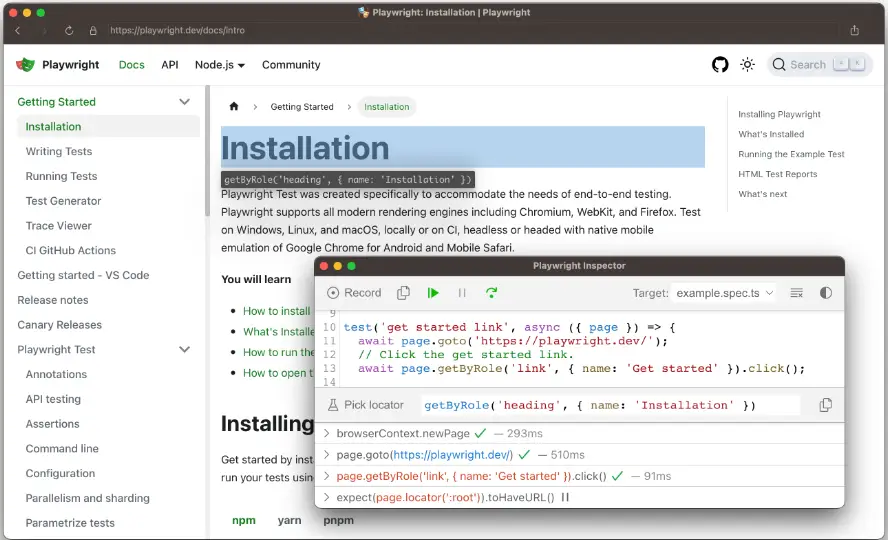
Live editing locators
When operating in debug mode, you have the ability to edit the locators in real-time. Adjacent to the ‘Pick Locator’ button, there exists a field that displays the locator on which the test is currently paused. You can modify this locator directly within the Pick Locator field, and the corresponding elements will be highlighted in the browser window.
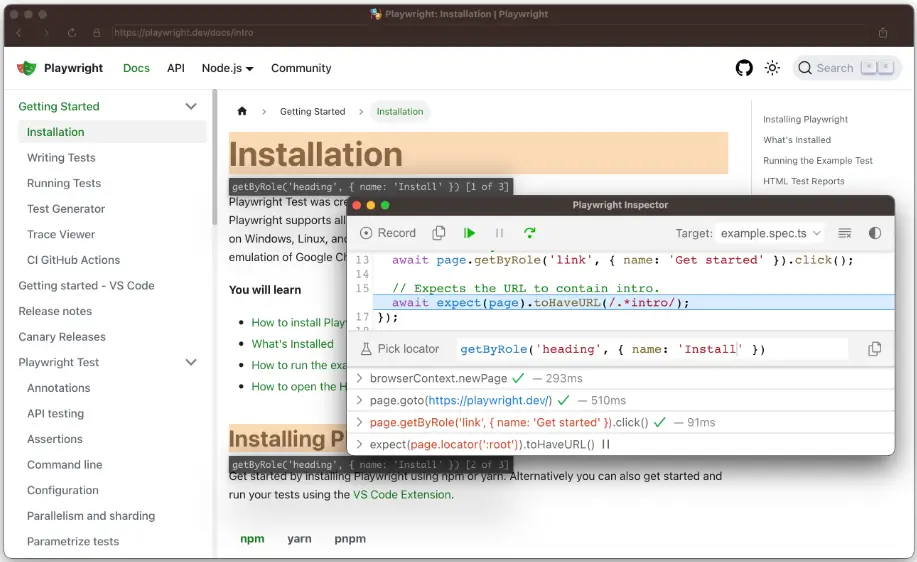
Picking locators
During the debugging process, it may be necessary to select a more robust locator. This can be accomplished by clicking the Pick Locator button and hovering over any element within the browser window. As you hover over an element, the code required to identify this element will be highlighted below. By clicking on an element in the browser, the locator will be added to the designated field, where you can subsequently modify it or copy it into your code.
Playwright will analyze your page to determine the most effective locator, giving precedence to role, text, and test ID locators. In the event that Playwright detects several elements corresponding to the locator, it will enhance the locator to ensure it is robust and can uniquely identify the target element, alleviating concerns about test failures caused by locators.
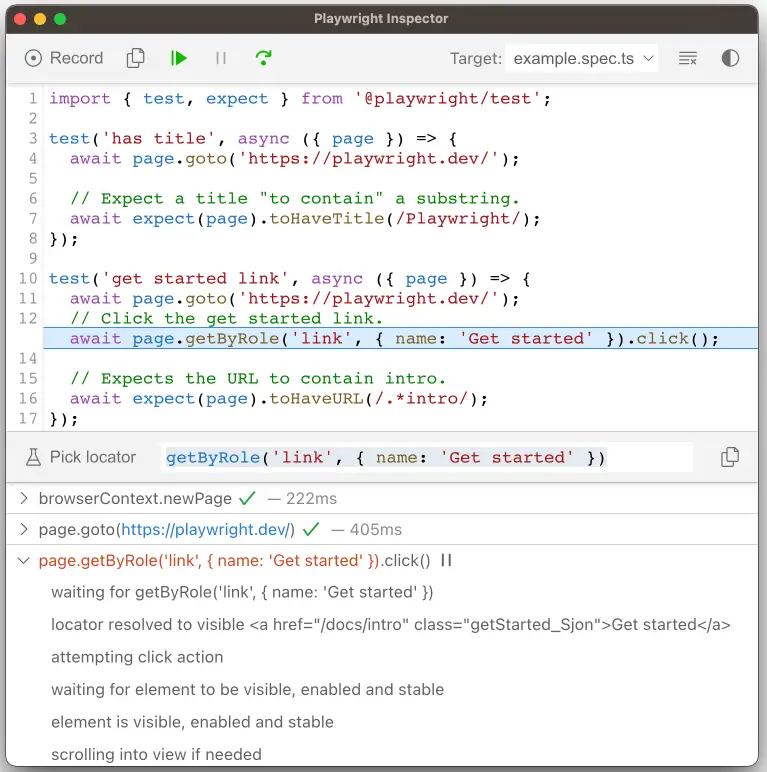
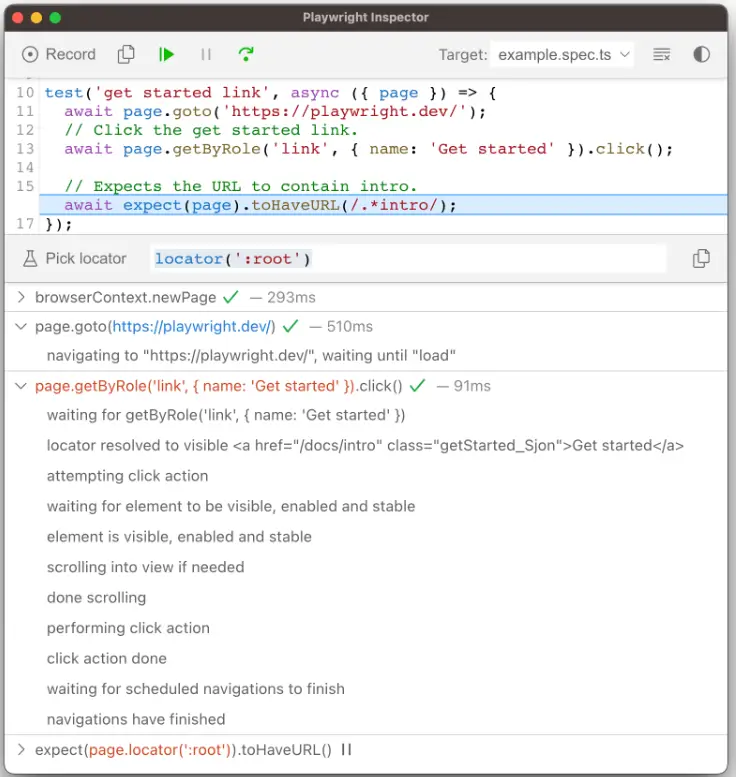
Actionability logs
When Playwright pauses on a click action, it has already conducted actionability checks that are recorded in the log. This information can assist you in comprehending the events that transpired during your test and the actions that Playwright executed or attempted. The log provides details on whether the element was visible, enabled, and stable, whether the locator successfully resolved to an element, whether it was scrolled into view, among other details. If actionability cannot be achieved, the action will be indicated as pending.
Trace Viewer
The Playwright Trace Viewer is a graphical user interface tool that allows users to examine recorded Playwright traces of their tests. You can navigate backward and forward through each action on the left side, visually observing what occurred during the action. In the center of the screen, a DOM snapshot for the action is displayed. On the right side, you can find action details, including time, parameters, return value, and logs. Additionally, you can investigate console messages, network requests, and the source code.
Playwright Essentials: A Step-by-Step Journey into Test Automation
Part 01: Master Playwright Testing – Framework from Scratch Guide
Part 02: How to install Playwright
Part 03: Basic Playwright Test Structure
Part 04: Importance of Playwright configuration file and its details to run the tests
Part 05: Writing Tests in PlayWright
Part 06: Playwright Actions Illustrated
Part 07: Auto-waiting
Part 08: Handling the Dialogs
Part 09: Download & Handling frames
Part 10: Locators
Part 11: Pages & New Window
Part 12: Page object models
Part 13: Debugging Tests VS Code debugger
Scroll to Top
Playwright Automation Testing from Scratch with Framework